17 Apr 2019 | Tech Update


It is widely understood that page loading speeds affect user experience, with it being reported that 40% of people will abandon a website that takes more than 3 seconds to load. 1
This week, Support Lead, Helen Grimbly is looking at the factors that affect the Performance results for an assessment of a site.
Factors that affect the Performance are:
- Download speed of all assets in the assessment. Assets are all URLs fetched during the scan.
- Initial response time of all assets in the assessment.
- The download time of the front page only.
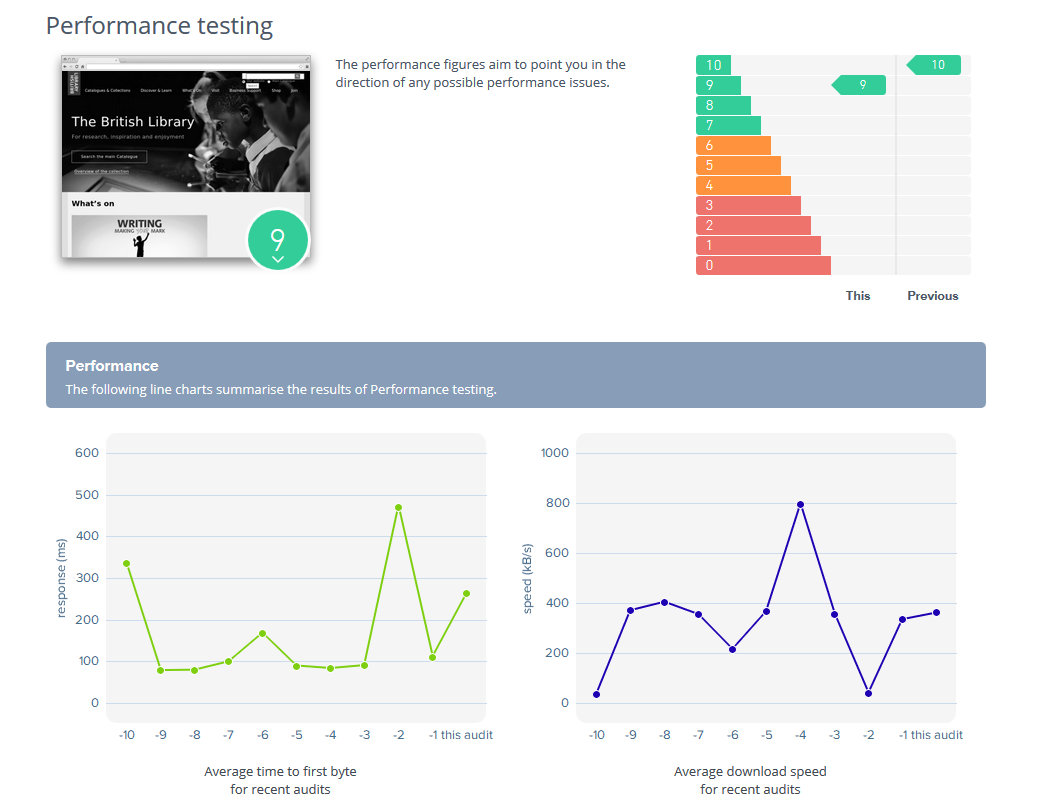
The two charts on the Performance summary page shows the 'Average time to first byte for recent audits' and 'Average download speed for recent audits' respectively. Each point on the charts represents an assessment, which could be scheduled or ad hoc, a 125 pages assessment or another number of pages like 5000. All the URLs fetched affect the Performance score, so a larger size assessment will have a greater number of assets that will affect the final Performance result.
The default audit for a site is 125 pages and 10 PDFs. This gives a good measure of how well the site is performing against the categories of test that Sitemorse performs. These 125 pages are usually the closest to the start page in terms of click depth, so they are also the pages accessed most frequently by your site visitors. For more about this see:
https://sitemorse.com/blog-article/9668/Developer-Corner-How-Sitemorse-assesses-a-site/
When you run a large audit containing hundreds or thousands of pages, you often see the performance score drop dramatically. What’s happening here?
The short answer is a drop in performance score is exactly what you should expect and if you don’t see it then there might be something wrong.
Here is the long answer.
Webservers tend to hold the most frequently accessed pages in cache memory so a quick response will be seen by site visitors who view these pages. Webservers do this automatically so that any page that is constantly accessed stays in cache memory and any that are not, are replaced by more popular pages. This is how webservers optimise their response to requests from site visitors. If a page is requested that is not a popular page, it won’t be in the cache memory, and this must be loaded from disk before the page can be sent to the site visitor. Loading from disk takes longer than responding from cache memory.
A 125-page audit starting with your home page will generally see a good response from your webserver as these pages are probably all in cache memory. A 5000-page audit starting at your home page will request many pages that are not in your webserver cache memory. These will have a much slower response and so the overall average performance score is expected to go down. In fact, if the performance of your webserver was the same for popular pages as it is for pages that are hardly ever accessed, then you might want to check your webserver cache memory configuration.
In a full site audit, it’s probably fair to say that Sitemorse is accessing pages that no site visitor has accessed for a long time and the last time some of these very unpopular pages were accessed, was by Sitemorse the last time you did a full site audit.
This article has a related video.