01 Jul 2016


Great page performance is essential to ensure a great visitor experience. It should start before you make the page live, which can be achieved within your CMS. Monitoring shouldn’t be limited to a few pages thereafter either, this is an introduction to how ‘Sitemorse CCA’ (Continual Content Assessment) keeps an eye on each and every page.
Introduction
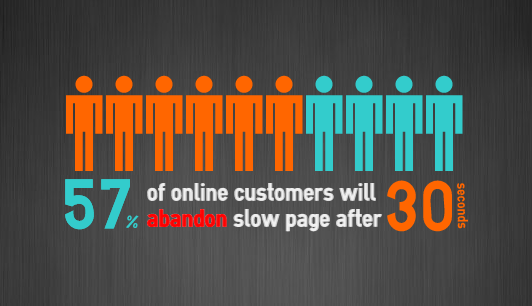
User experience is key in the digital world of today, and sites are expected to be seamless and always available. To be able to achieve this, a website must perform well. Most websites perform well overall but often have poor performing elements which are hidden by well performing elements. These elements could be impacted by slow server response time and download times.
Another factor which could be affecting a site’s performance is third party content, and now, with many third party additions available for websites, this is becoming more and more of an issue. Third party content can include advertising, testing and re-marketing services, all of which an asset owner may have little or no control over posing a risk to their website performance. This reason alone is one of the key reasons as to why it is impossible to assess performance manually or within a Content Management System (CMS).
Accurate performance assessing is crucial and there are various tools available on the market that offer these services, however, very few of these services check all content across all pages. By not testing all content, unnecessary business risks can be left across a site which may affect user experience. For example, if a site cannot handle the volume of traffic it receives on a daily basis and therefore consistently crashes, customers may go elsewhere for products or services. In addition to this, Google now also takes page loading times into consideration when ranking a site, making it ever more important to constantly monitor a website performance as this can help ensure that a site receives traffic from Google.
Performance Testing
Sitemorse offers two main types of website performance testing. "Snapshot", a handy tool that can test a single page, and full site testing which is run as a part of a full site audit.
 In today’s digital world, internet connection speeds are continually improving. Therefore, to have a realistic indication of the performance of a web page for users around the world, Sitemorse has taken into consideration Akami’s classification of broadband speeds. Within their State of the Internet report in quarter 4 of 2014 "high broadband" data was defined as being for connection speeds greater than 10 Mbps, and "broadband" is for connections of 4 Mbps or greater.
With this in mind, as a measure of performance of a page, Sitemorse has set the "Broadband" threshold to be 4 Mbps (512 Kb) and "Fast broadband" a threshold of 10 Mbps (1280 Kb). The Akamai report also defines the UK average page load time as 3.798 seconds. With this in mind, Sitemorse has chosen 6 seconds for Broadband (e.g. ADSL), and 4 seconds for Fast broadband (e.g. fibre optic).
Single Page Reporting
Knowing how a particular page performs can be essential in various organisations as often different assets are often owned by a variety of people.
Snapshot
The in-browser "Snapshot" tool provided by Sitemorse can be run against any publicly accessible web page therefore allowing anybody, to check any page, at any time. Snapshot is independent, always up-to-date and exceptionally thorough, it carries out over 600 individual checks on each page. Not only that, but Snapshot interprets the website from the point of view of the online user, which means, for example, it will pick up links to internal servers that CMS systems often miss. Therefore, content editors can instantly check their own pages without having to spend time liaising with the digital team to run timely tests on the site.
Once a Snapshot test has been run, the results returned include a Performance button which, when selected, shows a graph (Figure 1) indicating how long the page took to download as well as the response and download times of the individual page assets. Any long green bars would suggest a particular page asset takes a long time to download, which could deter users from staying on or returning to the page.
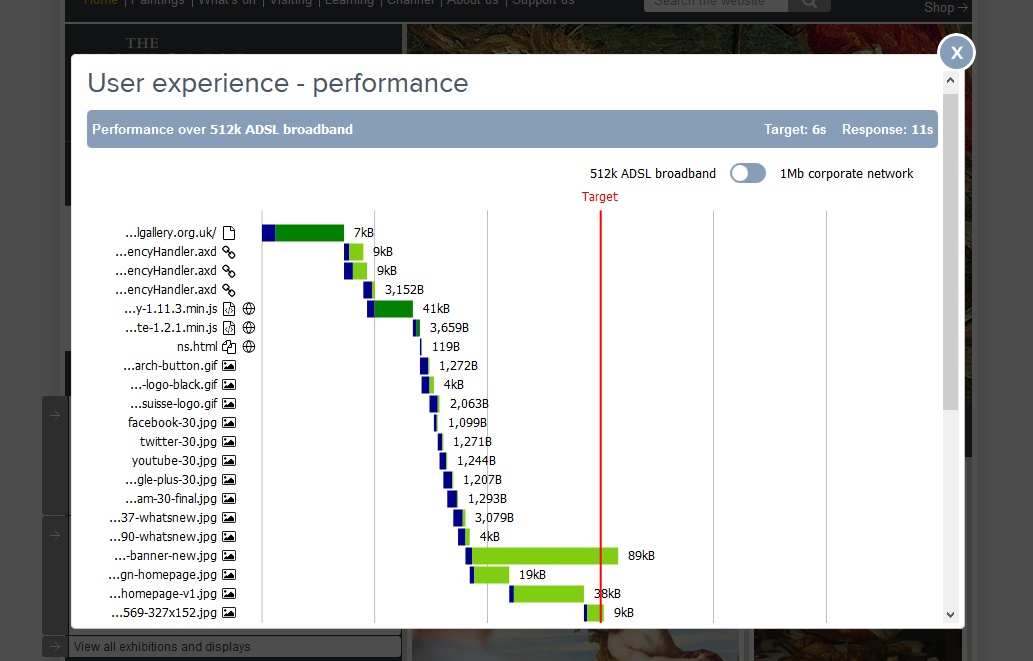
Figure 1 - Snapshot Performance Category
Graph key:
- Dark green - Single threaded download - browser cannot continue until Javascript code has been downloaded and executed.
- Blue - Response time for a page asset
- Green - Download time for a page asset
The Landing page (homepage)
The landing page (homepage) of any website is seen as one of the most indispensable on any site as this page is often the first impression that a user will receive of the digital asset. Therefore, this page must be performing well at all times to ensure that a user does not get frustrated and leave the site.
Along with other monitoring software that Sitemorse can provide as part of a full site audit, the landing page of a site can be audited in a way that can generate a graph similar to Figure 1. This can be viewed in a Sitemorse Report, under the category 'SEO and Metadata’, by selecting Landing page and then Page download.
It is particularly important to have the landing page performing well at all times, as it is often the page users land on from a search engine. Therefore, if a landing page is taking too long to load when it is clicked through from a search engine such as Google, users are likely to leave the website. This is a behaviour that Google can track, which can lead to a negative impact on the websites ranking.
Full Site Reporting
Sitemorse offers full site assessments which can be run on as few as 10 pages to as many as 250,000 pages. When a Sitemorse assessment is carried out for a site, the results are shown in a Report. As performance is assessed individually there is a performance category of the report and a score out of 10 is provided. The score awarded is determined by a combination of the time it took to receive an initial response from each page assessed, as well as the time it took to download each page.
By having pages that respond well (under three seconds) it can help to retain the attention of visitors and therefore can encourage them to remain on the site. The report will show the 10 slowest pages for initial response and download times, as well as highlighting any pages that are particularly slow (over five seconds to load).
The report also includes a Performance Icon which may indicate if the site has some very slow pages and Performance Graphs which show overall site performance. Sitemorse also runs an INDEX every quarter which shows how websites are doing overall and in individual categories compared to their competitors.
Performance Icon
The report audits for many other functionalities which are separated out into categories with icons. The Performance category shows its mark out of 10 and will display an exclamation mark next to the category if the site has any specific pages which are found to have very slow response times. This icon may be shown even if the overall performance score is high as, even though most pages may perform well, a few pages may still be very slow.
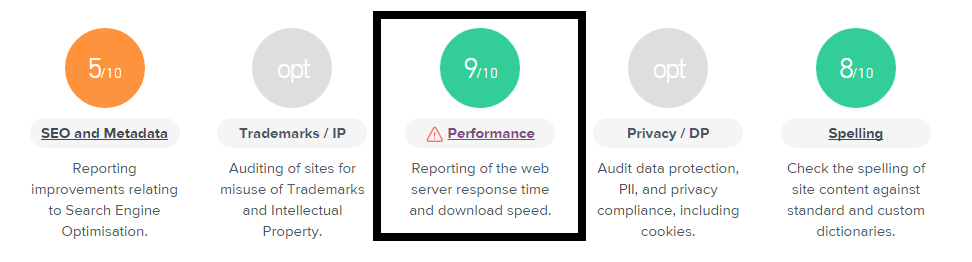
Figure 2 - Report - Performance Icon
Performance Graphs
Within the report, it is also possible to view the average response and download times of all pages within an audit. Once the Performance category is selected this will be shown in two graphs respectively, with up to 10 historic audit performance results. This is particularly useful as from an asset owners point of view it is possible to see how any changes that are being made are affecting the websites performance.
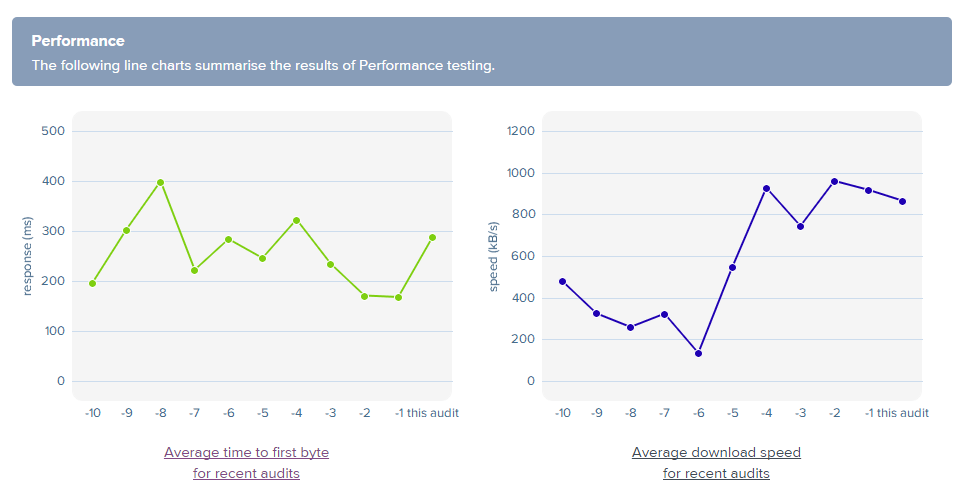
Figure 3 - Report - Performance Category Summary
By selecting either graph from the Report Performance Summary page, a larger version of that graph will appear as well as the 10 slowest pages in the audit. Any pages that are particularly slow will be marked with an exclamation mark. For example, the first page URL shown in Figure 4 shows a page that took 10,803 ms, or nearly 11 seconds, to receive a response from that page, at the time of the audit.
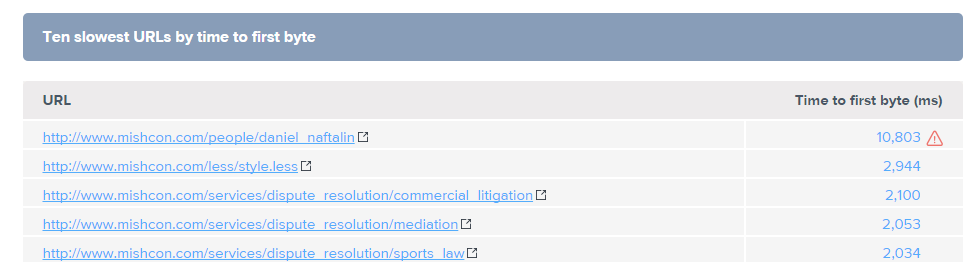
Figure 4 – Report – Slowest URL’s
Every second counts when it comes to page loading speeds and with a page taking over 10 seconds to load, serious but unnecessary risks are left open. It is believed that every one second delay in a page responding can result in a 7% reduction in visits converting to sales. To put this into perspective, for an e-commerce site which is making around £75,000 per day, a one second delay in average site loading times could potentially cost the site owner around £1.85 million in lost sales annually.
The INDEX
Sitemorse runs an INDEX (Sitemorse INDEX) every quarter that audits the top 125 pages of each website in the relevant sector. The audit produces an overall and individual category scores for each site which are released in a table, making it easy to compare results between peers. As with the full site testing, each website is given an overall score and individual category scores out of 10. One of these categories is performance.
When looking at the full results of a specific site, a graph is shown which displays the sites performance score over the past 10 audit runs making It clear to the asset owner if any recent changes have made an impact on this score. Being able to compare scores against competitors is very useful as it can highlight areas where a site could be losing out to its peers and therefore losing business.
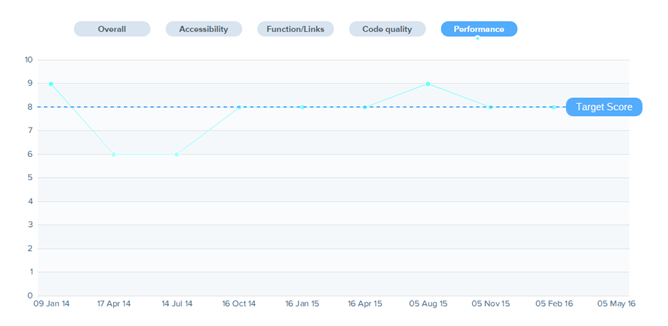
Figure 5 – INDEX Performance Category Graph
Conclusion
Having a website that performs well is one of the key factors in getting users to remain on and return to a site. It can also affect future potential users as poor performance experienced after clicking through to a site from Google but then leaving can affect a websites ranking for future searches on Google.
It is therefore essential to use a tool which monitors a website’s performance. By using such tools asset owners can gain clarity in where there are performance issues on their website which need to be rectified to achieve the best performing website and user experience possible.
If using either or both of these tools that Sitemorse can provide, digital asset owners can consistently monitor their sites to ensure their assets are performing well and that user experience is not compromised. Therefore, replacing hope with confidence.