24 Mar 2021 | Index | Accessibility


Sitemorse published the first INDEX in 2006, raking the performance of websites. Fast forward 15 years and there are a number of organisations publishing ranking tables. This should be good news as it can only increase awareness of website quality and in particular, accessibility.
However, the reality is somewhat contrary. It is reasonable to expect some relatively small differences in ranking position however, more concerning is some extreme differences in scores.
This article sets out to help bring some clarity as to what may be transpiring.
The purpose of an Index or ranking table
An Index enables the organisations to see their website score and how they compare to other organisations in the INDEX.
Some organisations place great importance on their position in the table however, we would suggest that should be of secondary importance. More important is that the score is increasing, reflecting improvement.
The Sitemorse INDEX?
Sitemorse established the standard for independent benchmarking of websites when it published the first INDEX of UK Local Government in 2006. This INDEX is published quarterly and benchmarks websites of all UK Councils and related organisations. The 2021 Q1 UK Local Government INDEX can be viewed at: https://sitemorse.com/index/uk-local-government/2021-q1
If we look at indexes of website performance, we have scores associated with measurement and in the specific case of accessibility, a fixed standard, WCAG 2.1 for which there are 3 levels of priority: Level A, Level AA and Level AAA. The current legislation requires websites to comply to the WCAG 2.1 Level A and AA priorities. Therefore, we do not include the results of the Level AAA techniques in the score.
The importance of independence
You don’t need to be a Sitemorse client to score well or to be top of the INDEX. We apply the same tests checks and measures (up to 1600) on each organisation’s web pages and pdf documents.
The result is an overall Content Risk Score, which is derived from scores across 6 categories. We examine the site the way a user would and therefore the score is a reflection of the number of actions and the number of pages affected.
We don’t weight scores according to any subjective criteria on how easy the issue is to fix or whether the same issue appears on multiple pages and can be corrected by making a simple change in a template - after all that makes no difference to the website user.
The INDEX includes a bar graph showing how the website score has changed each quarter over the last 10 years.
Why are results different?
Recently a number of alternative ranking tables have been published, some even call them Indexes – as Oscar Wilde said “imitation is the sincerest form of flattery that mediocrity can pay to greatness”. Somewhat inevitably, the results of these ranking tables are different. This causes confusion, maybe even a false sense of security.
We are often asked how the same website can score differently across the various ranking tables. To address this question let’s look at 2 examples:
Severn Trent Water
If we take Severn Trent Water as an example. The Silktide ranking provides an accessibility score for their website (https://www.stwater.co.uk) of 80 (out of 100), yet at Sitemorse we score the site as zero (out of 10). If we delve into the accessibility scores in a bit more detail, we see:
|
Results |
Silktide |
Sitemorse |
|
Accessibility Score |
80/100 |
0/10 |
|
Pages Passing Level A |
86.9% |
0% |
|
Pages Passing Level AA |
79.4% |
1% |
|
Pages Passing Level AAA |
62.6% |
8% |
So what’s going on, how can the difference in scores be so extreme?
We believe in conducting very thorough tests and delving into the detailed techniques defined within the WCAG specifications. Our role at Sitemorse is to report the results as we find them. We often receive feedback from clients that we report many more issues than other providers; but we make no apology for that.
The differences could be explained due to testing different things or weighting the results differently however, it is more likely due to the interpretation of the results.
In this example the Sitemorse score of 0% of pages passing the Level A techniques means that every single page tested failed at least one WCAG technique. The Silktide score of 86.9% could refer to the percentage of pages that passed some of the Level A techniques. The difference in interpretation is quite subtle however the difference in scores is quite marked.
At Sitemorse we prefer to report on the scale of the problem from an external (website visitor) perspective: the number of issues that may be encountered by a website visitor for example, using a screen reader. On that basis we believe it is important for the website owner to understand that an issue could be encountered on every single page.
If we take a quick look at the Severn Trent website’s home page:
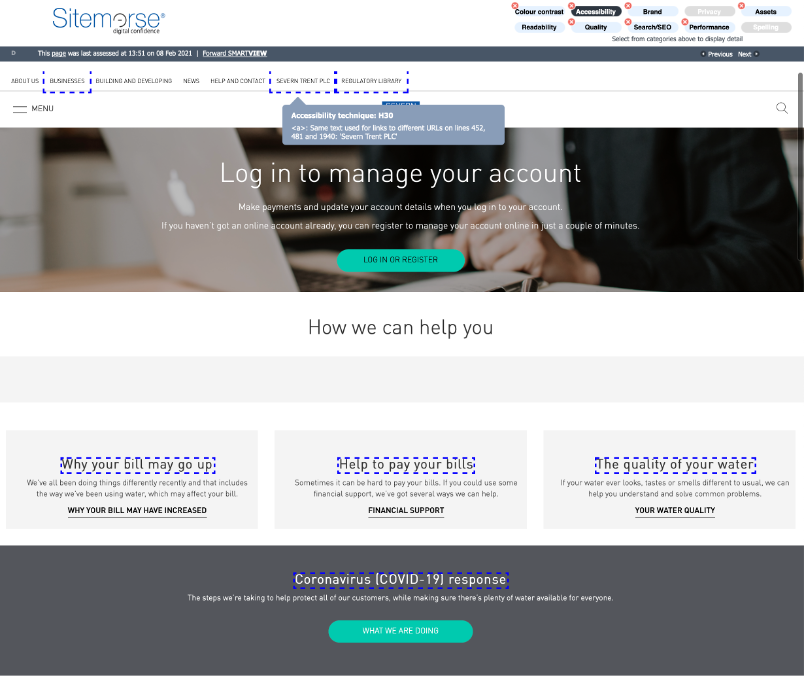
We can see a number of accessibility issues. We’ve highlighted an issue with the Top Navigation menu, which has failed the H30 technique, a rather basic error. The same text is being used for different links, potentially very confusing for a visitor using a screen reader.
We have looked at 15 of most basic WCAG 2.1 techniques; those that organisations should not be failing.
The Severn Trent Water website fails 14 of these basic techniques as can be seen in the table below:
|
Technique |
Description |
Levels |
Occurrences |
|
C22 |
A, AA, AAA |
335 |
|
|
F17 |
A |
255 |
|
|
F30 |
A |
0 |
|
|
F38 |
A |
245 |
|
|
F65 |
A |
245 |
|
|
F84 |
AAA |
106 |
|
|
F89 |
A, AAA |
15 |
|
|
G82 |
Providing a text alternative that identifies the purpose of the non-text content |
A |
245 |
|
G100 |
A |
245 |
|
|
G130 |
|
16 |
|
|
G141 |
A, AAA |
358 |
|
|
H30 |
Providing link text that describes the purpose of a link for anchor elements |
A, AAA |
2,325 |
|
H37 |
A |
245 |
|
|
H44 |
Using label elements to associate text labels with form controls |
A |
125 |
Sitemorse identifies priority actions to address, these are the actions that will have the greatest impact on improving a website. For the Severn Trent Water website, we have identified 643 occurrences of the issues in the Priority Actions and well as more than 1000 Secondary (Level A) actions and 485 Tertiary (Level AA) actions.
Cambridge County Council
For our second example, we will consider the website of Cambridge County Council https://www.cambridgeshire.gov.uk/
Monsido have recently compiled a ranking table of what they call the Top 50 UK Council websites. Cambridge County Council is in second place for Accessibility with an ‘Accessibility Compliance Score’ of 74.65%.
Cambridge County Council doesn’t make the Top 30 Council Websites in the Silktide Index. Silktide have assigned a score of 80 (out of 100) for the Cambridge County Council website.
Sitemorse scored Cambridgeshire 5 (out of 10) for Accessibility with a ranking of 210 in the Sitemorse INDEX for UK Local Authority websites.
It is important to note that Monsido only considers 50 UK councils – they “…tested all 25 County Councils and the 25 largest (by population) District Councils”, although it would seem only councils in England have been included.
Silktide and Sitemorse have both elected to include all 404 UK council websites in their respective rankings.
|
Results |
Silktide |
Sitemorse |
Monsido |
|
Accessibility Score |
80/100 |
5/10 |
74.65% |
|
Pages Passing Level A |
94.8% |
13% |
|
|
Pages Passing Level AA |
70.2% |
73% |
|
|
Pages Passing Level AAA |
63.6% |
46% |
|
If we look at the same 15 basic WCAG 2.1 techniques, then we see that the Cambridge County Council website fails 4 of these basic techniques:
|
Technique |
Description |
Levels |
Occurrences |
|
C22 |
A, AA, AAA |
30 |
|
|
G141 |
A, AAA |
81 |
|
|
H30 |
Providing link text that describes the purpose of a link for anchor elements |
A, AAA |
68 |
|
H44 |
Using label elements to associate text labels with form controls |
A |
34 |
For the Cambridge County Council website, we have identified 34 occurrences of the issues in the Priority Actions and well as 524 Secondary (Level A) actions and 66 Tertiary (Level AA) actions.
Conclusion
The confusion of having multiple ranking tables with different scores and results is unhelpful. Whilst it can be argued that none of the ranking tables are wrong, we believe this is missing the point – helping organisations improve their websites and ensuring the content complies with the law. Ensuring your content is accessible and doesn’t discriminate is, quite simply, the right thing to do.
Sitemorse firmly believes in presenting the facts in order to facilitate improvement. We do just that, we would never apply weightings to manipulate results with the objective of growing our client base.
The Sitemorse score focuses on the number of issues on your website and how many pages are affected by these issues. It is representative of how a user may experience a website. If you want to know the facts, everything on your website that needs attention then the Sitemorse INDEX is for you.
If your preference is to view things wearing rose tinted glasses, then perhaps you should look elsewhere.