PERFORMANCE CATEGORY


An introduction to the Performance Category.
Performance
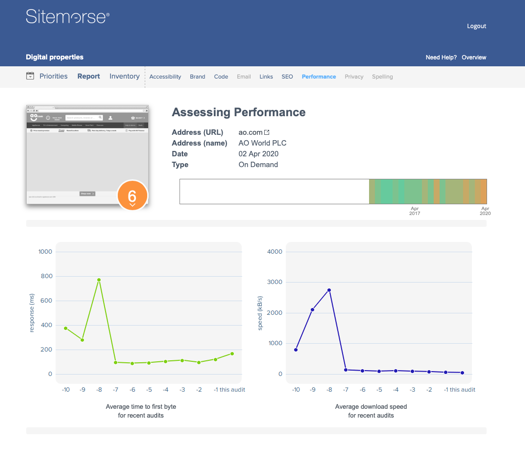
The Performance Assessment has the familiar Management Zone at the top, which incorporates the summary KPI information as well as the Year at a Glance.
The Year at a Glance allows you to see how the results have changed over the last year. As you mouse over the bar you can see how the score has changed. You can click on the bar to view the assessment results from the displayed date.
Below the management zone are two charts. The chart on the left shows the average time to first byte and the one on the right the average download speed.
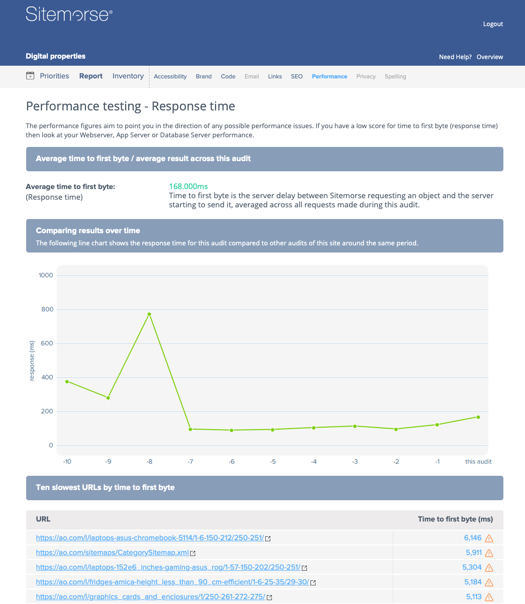
The average time to first byte is the time it takes your system to respond to a web request.
One of the things that causes performance issues on websites is when pages take a long time to respond, which is very frustrating for the user.
Looking deeper into the average time to first byte, we see that although overall this site is quite good, there are a number of pages that are taking around 6 seconds until anything happens – that’s not a great user experience.
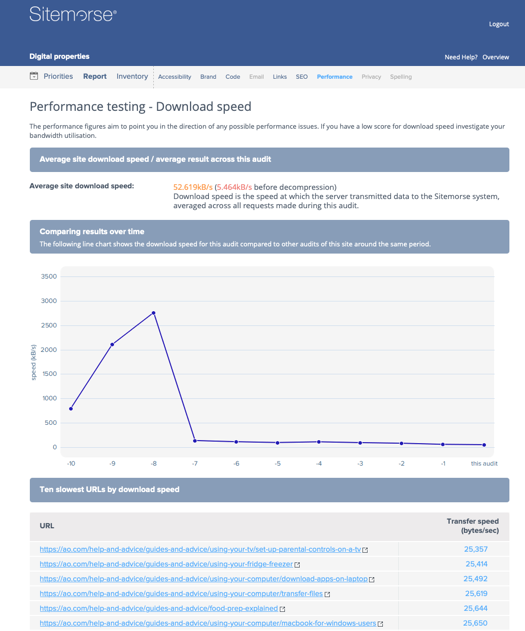
The chart of download speed is a good indication of the webserver’s ability to deliver pages and whether it is getting overloaded.
The average site download speed is shown in red, orange and green, which gives an indication of the performance.
Share this page