Content Assessment Summary


![]() Introduction
Introduction
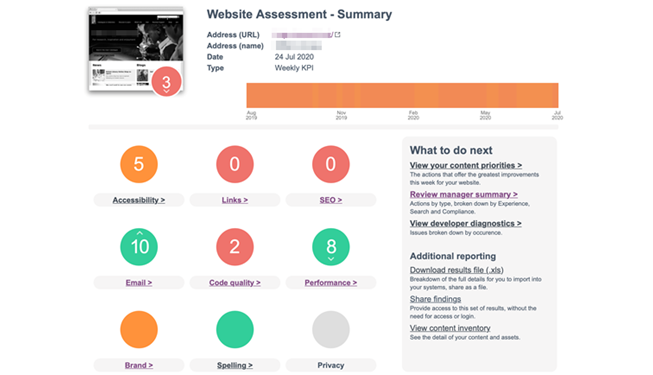
The report categorises your assessment into different areas such as accessibility, code quality, function / links, etc. It contains an individual score for each category so you can determine the areas that might need to be addressed first.
A score out of ten and colour code is shown for each category: Red for 3 or less, Amber between 4 and 6 and Green for 7 and above.
Walkthrough
Content Assessment Summary
The Sitemorse report screen shows the assessment results. It is divided into 3 main zones.
At the top is the Management Zone, which incorporates the summary KPI information as well as the Year at a Glance.
The Year at a Glance allows you to see how the accessibility results have changed over the last year. As you mouse over the bar you can see how the score has changed. You can click on the bar to view the assessment results from the displayed date.
The Report Zone is on the left and this summarises the assessment results and shows how the number of Priorities, Secondary and Tertiary actions have changed since the previous assessment.
The Action Zone is on the right, this includes the What to do next section where you can view the priority actions